Dataset
The dataset contains 1211 DAG executions from 2 computational science workflows and 1 ML data science workflow, under normal and anomalous conditions. These workflows were executed using Pegasus WMS - Panorama. Synthetic anomalies, were injected using Docker’s runtime options to limit and shape the performance. The table below presents the breakdown of DAG executions per type, and the data have been labeled using 6 tags (normal, cpu_2, cpu_3, cpu_4, hdd_5 and hdd_10).
normal: No anomaly is introduced - normal conditions.
CPU K: M cores are advertised on the executor nodes, but on some nodes, K cores are not allowed to be used. (K = 2, 3, 4M = 4, 8 and K < M)
HDD K: On some executor nodes, the average write speed to the disk is capped at K MB/s and the read speed at (2xK) MB/s. (K = 5, 10)
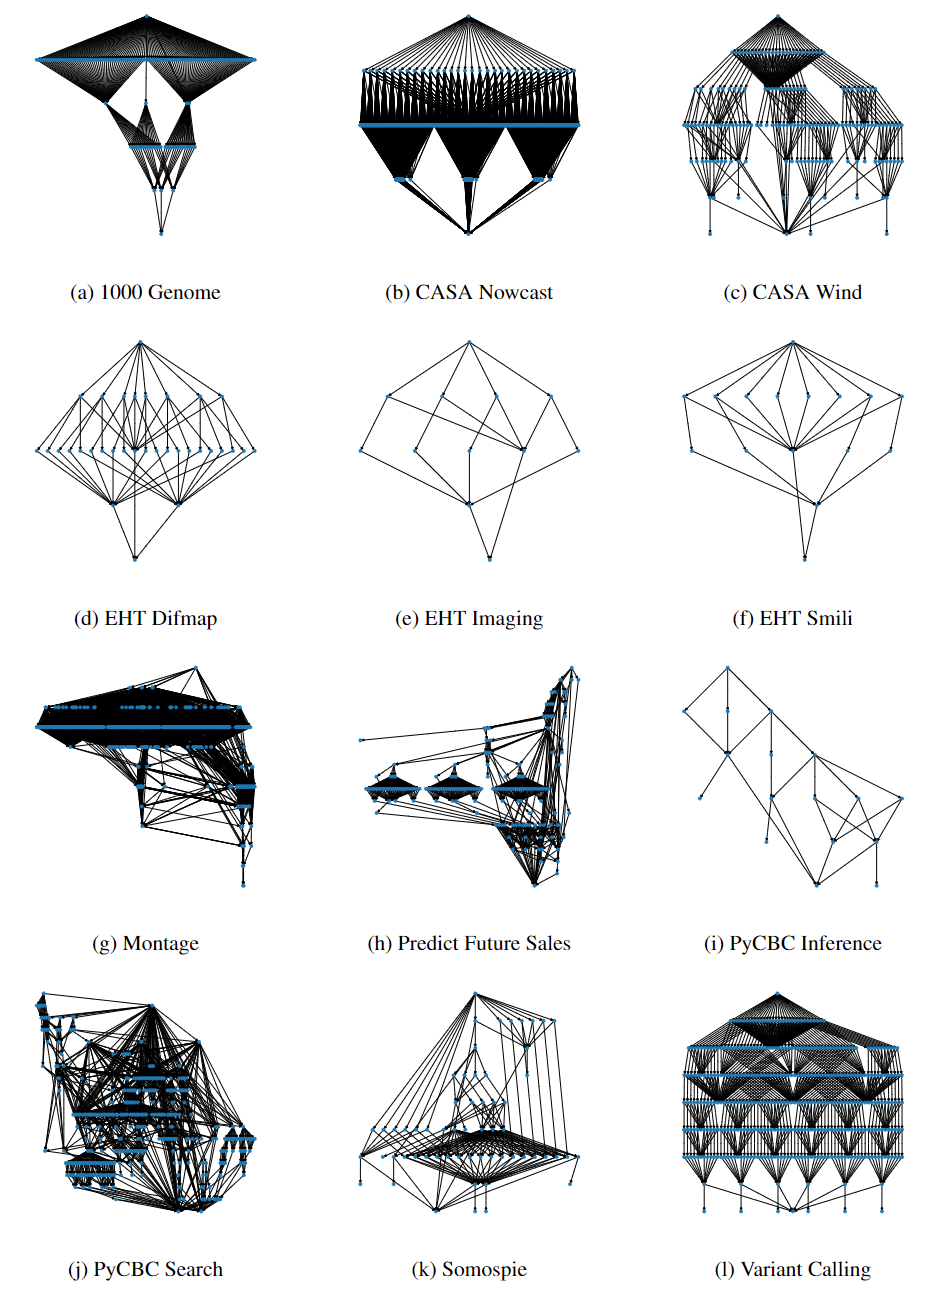
Figure: DAGs representation of each workflow in the dataset.
Workflow Dataset Statistics
| Workflow | DAG Information | #DAG Executions | #Total Nodes per Type | |||||||||||
|---|---|---|---|---|---|---|---|---|---|---|---|---|---|---|
| Nodes | Edges | Normal | CPU | HDD | Normal | CPU | HDD | |||||||
| 2 | 3 | 4 | 5 | 10 | 2 | 3 | 4 | 5 | 10 | |||||
| 1000 Genome | 137 | 289 | 50 | 100 | 25 | - | 100 | 75 | 32261 | 5173 | 756 | - | 5392 | 4368 |
| Montage | 539 | 2838 | 51 | 46 | 80 | - | 67 | 76 | 137229 | 4094 | 11161 | - | 8947 | 11049 |
| Predict Future Sales | 165 | 581 | 100 | 88 | 88 | 88 | 88 | 88 | 72609 | 3361 | 3323 | 3193 | 3321 | 3293 |
| Variant Calling | 371 | 792 | 80 | 80 | 80 | - | 75 | 80 | 115588 | 8287 | 7222 | - | 7365 | 8083 |
| CASA Wind Speed | 162 | 342 | 150 | 200 | 200 | - | 200 | 160 | 116836 | 8793 | 8382 | - | 8305 | 5104 |
| CASA Nowcast | 2081 | 4029 | 101 | 80 | 78 | - | 79 | 83 | 685045 | 49960 | 46664 | - | 46104 | 48328 |
| CASA Nowcast Small | 419 | 795 | 80 | 80 | 80 | - | 80 | 79 | 128562 | 10031 | 9592 | - | 9427 | 9569 |
| Soil Moisture | 60 | 185 | 125 | 98 | 97 | - | 92 | 93 | 24408 | 1706 | 1428 | - | 1344 | 1414 |
| PyCBC Inference | 17 | 26 | 206 | 89 | 74 | - | 67 | 66 | 6970 | 549 | 326 | - | 388 | 301 |
| PyCBC Search | 220 | 704 | 102 | 100 | 100 | - | 104 | 100 | 151004 | 9495 | 9039 | - | 8324 | 8346 |
| EHT Difmap | 33 | 59 | 142 | 93 | 88 | - | 89 | 89 | 13000 | 1059 | 737 | - | 877 | 860 |
| EHT Imaging | 12 | 18 | 212 | 76 | 74 | - | 70 | 69 | 4908 | 354 | 241 | - | 261 | 248 |
| EHT Smili | 16 | 26 | 148 | 87 | 84 | - | 90 | 93 | 6471 | 437 | 325 | - | 382 | 417 |